Continuing the lab from a week ago when I started using ArcGIS and ArcScene, I attended a workshop hosted by Dr. Christina Hupy to learn more about the open source alternatives to the ESRI products. This was particularly great news for me because ESRI’s products are quite expensive if being used for personal projects. QGIS is a new open source software that is free to download and allows for custom modifications to the code.
Being open source is great for development because it allows for changes to be made much faster and gives the community a chance to audit the changes before they are added. This is the same for many other platforms such as the Pixhawk and Arduino which are built entirely with open source hardware and software. Other open source products have been getting more attention lately within the UAS industry which opens up opportunities for more people to come up with ideas and even create forks of the original code if they are unhappy with it for some reason.
Another topic heavily discussed during the workshop was what GIS is. Many people would assume that it refers to a piece of software or a portion of the UAS inspection industry, but it encompasses much more than that. GIS is the collection of people, satellites, UAS data, and metadata required to create a map accurately.
After getting the introduction out of the way, we moved on to essentially recreate the same maps and projects we did in the previous lab. The first thing we did was create a hillshade image of the Wolf Paving dataset used last week. This was done by loading the appropriate plugins, adding the data layer, and selecting the layer properties of the DEM. Next, we added the color ramp and the min and max values of the DEM were adjusted to maintain as much resolution in the data as possible. From there we generated the DEM with a hillshade effect and adjusted the transparency of the top layer to make the image show both layers.
The creation of the hillshade was similar to that of the ArcGIS assignment, but QGIS gives the user more options to fine tune the imagery being created. This could be particularly useful for an individual who knows a lot about GIS and needs something with more options.
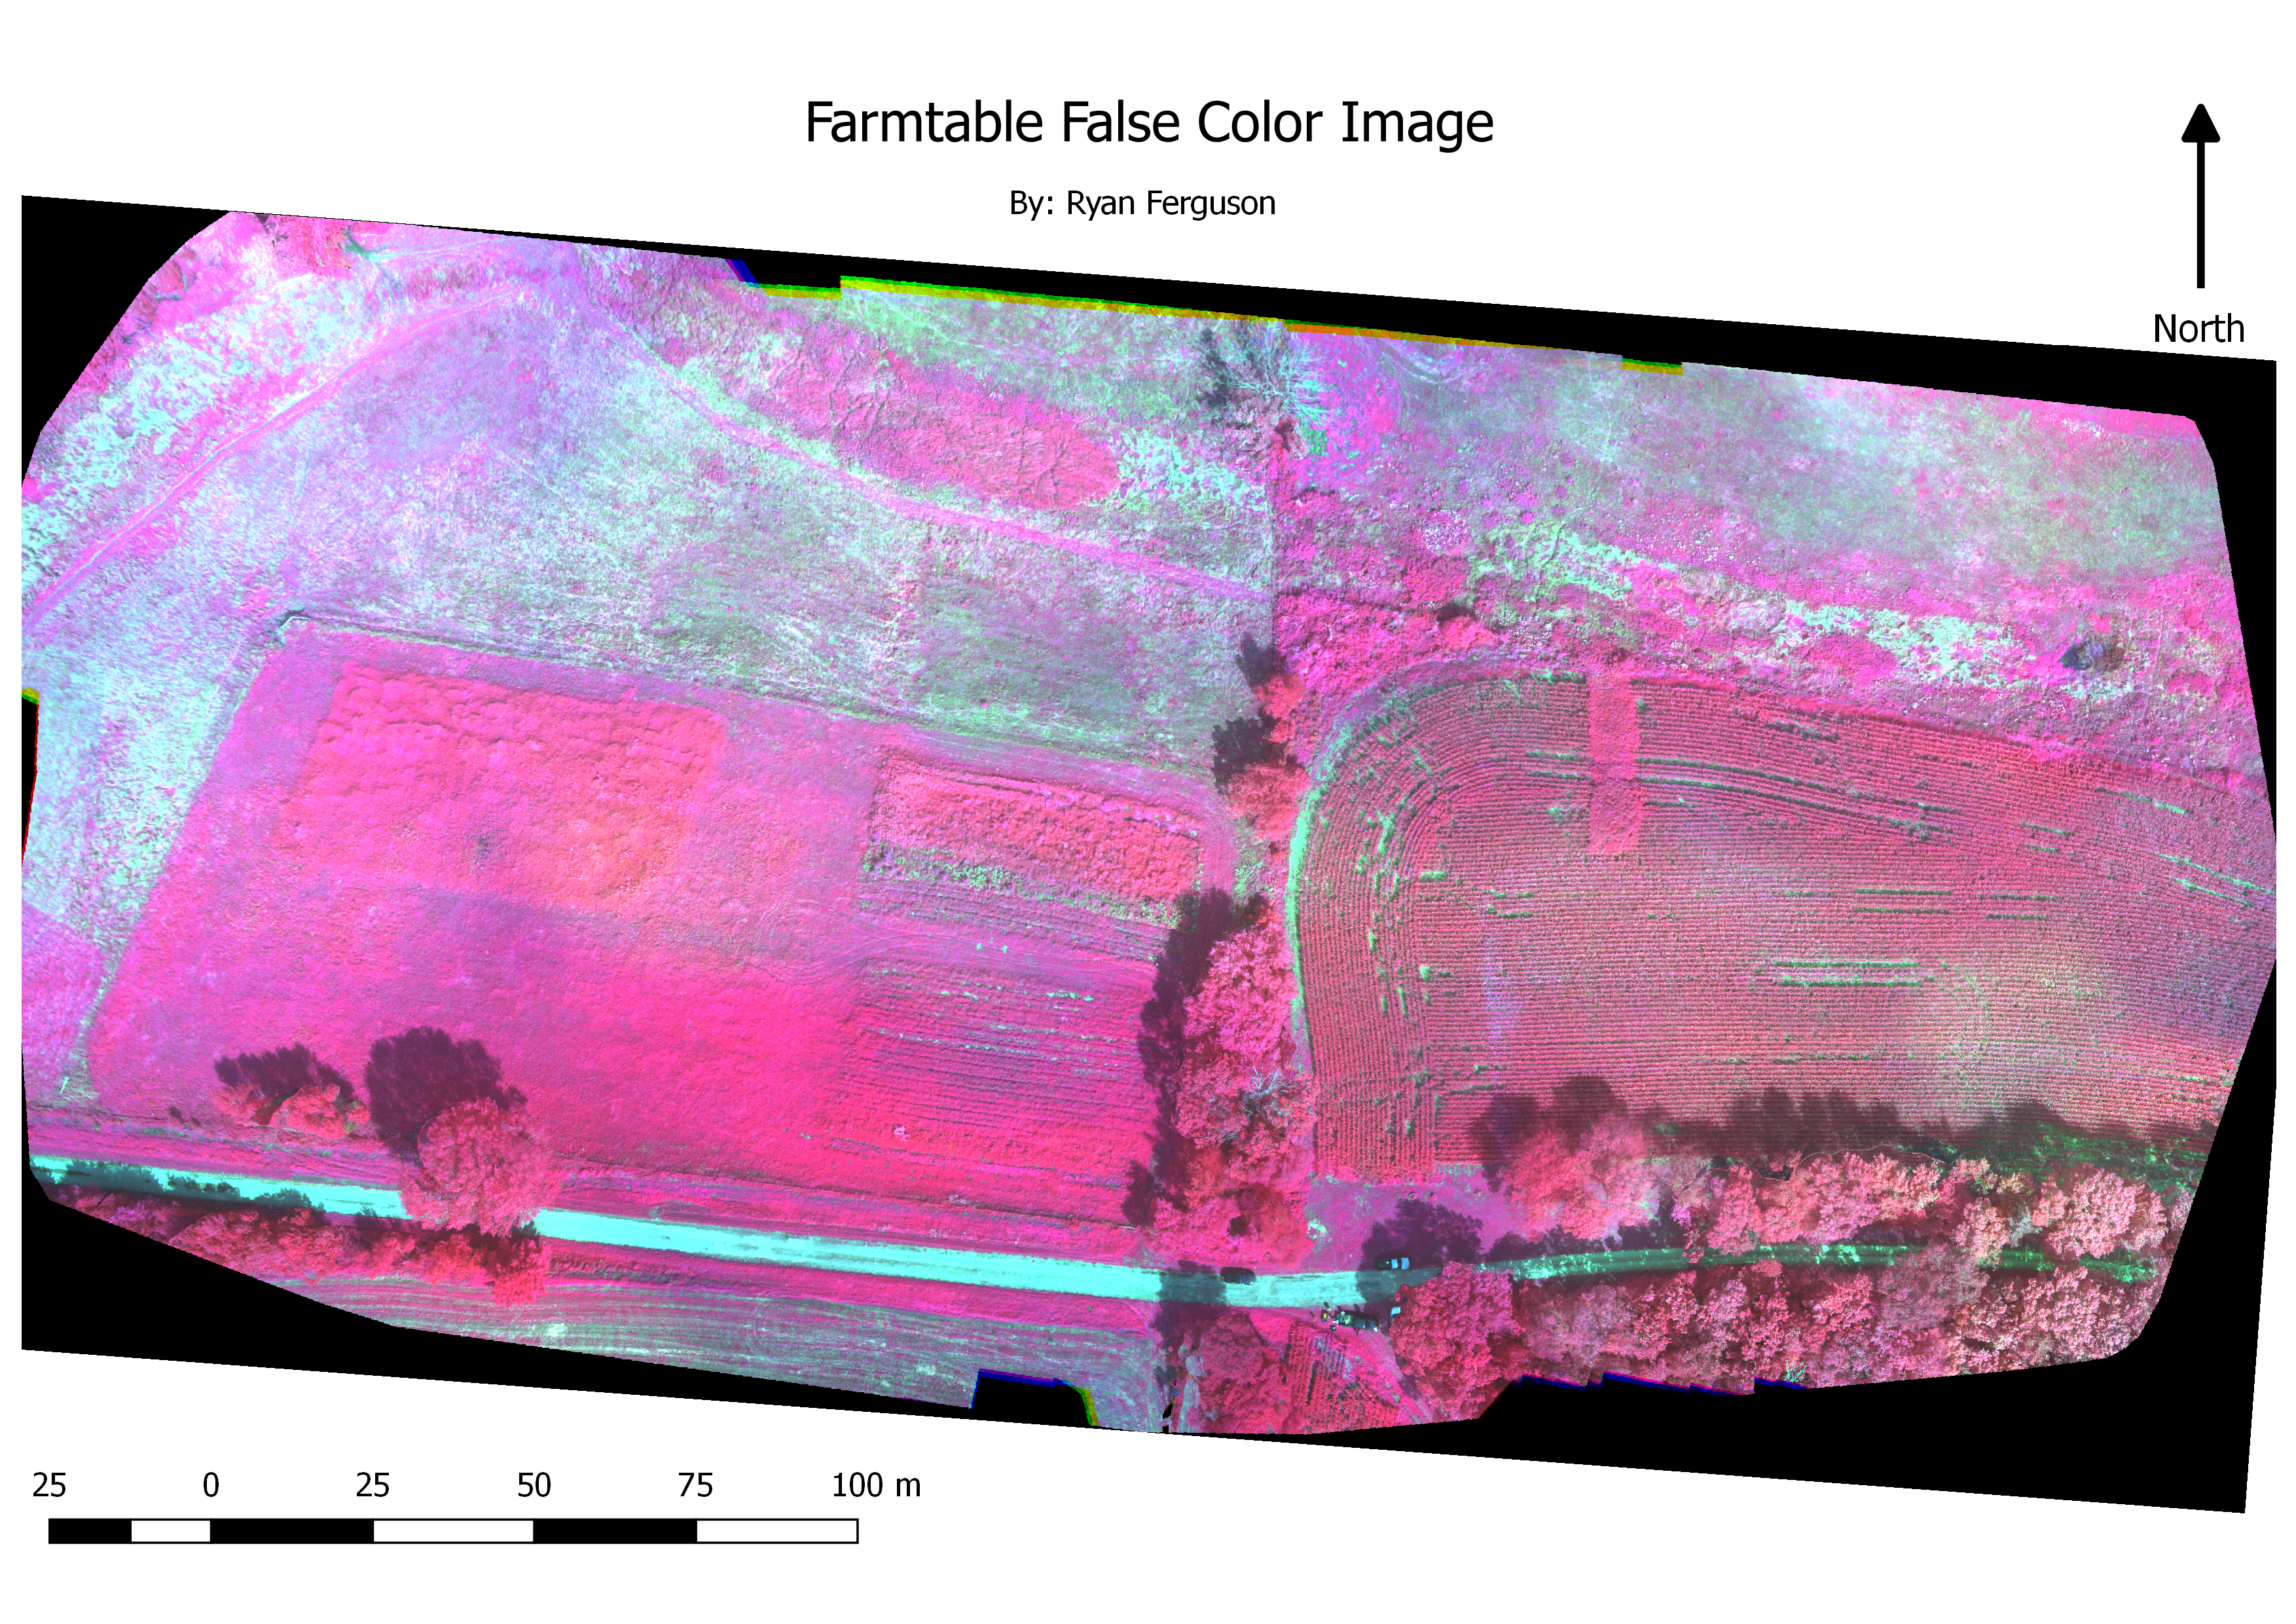
One of the lesser known facts about image formats is that they can often times store more than the standard 3 RGB color bands in them. This is particularly helpful for multispectral imagery where 5 different bands are being recorded in the same image. Creating these images from QGIS is slightly more difficult than ESRI, but similar results can be achieved. Creating the “false color” image was done by importing the multispectral images as individual layers and stacking the layers to form a multi band image. From here, a lot of trial and error was needed to tune the resulting image properly since the software didn’t track what band color was which number.
To conclude this project, I learned that I prefer QGIS over ArcMap and ArcPro due to its layout which seems more native to me. The fact that it’s open source demonstrates that it won’t be disappearing any time soon and will continue to be developed for a long time or until something better comes out. There are also several plugins which would be particularly useful for aerial imagery processing, such as the one which allows for automatic classification of aerial imagery and many others with their own specialized functions.